
The RI Indicator is a proprietary quantitative model developed by Return Insights that classifies stocks using clearly defined statistical criteria. Using this classification, the rules‑based RI Index is constructed, and its composition is updated monthly in accordance with the model logic. RI conducts its analyses autonomously and independently, based solely on quantitative and publicly available data.
The chart below shows the performance of an illustrative savings plan with monthly contributions of €180 and annual increases of 2.00% over the period 29 July 2016 to 17 July 2026, before taxes. The capital development is based on the RI Index or the RI Index excluding exposure to defence‑sector stocks. For context, capital developments for the S&P 500 and the MSCI World are shown as comparative benchmarks.
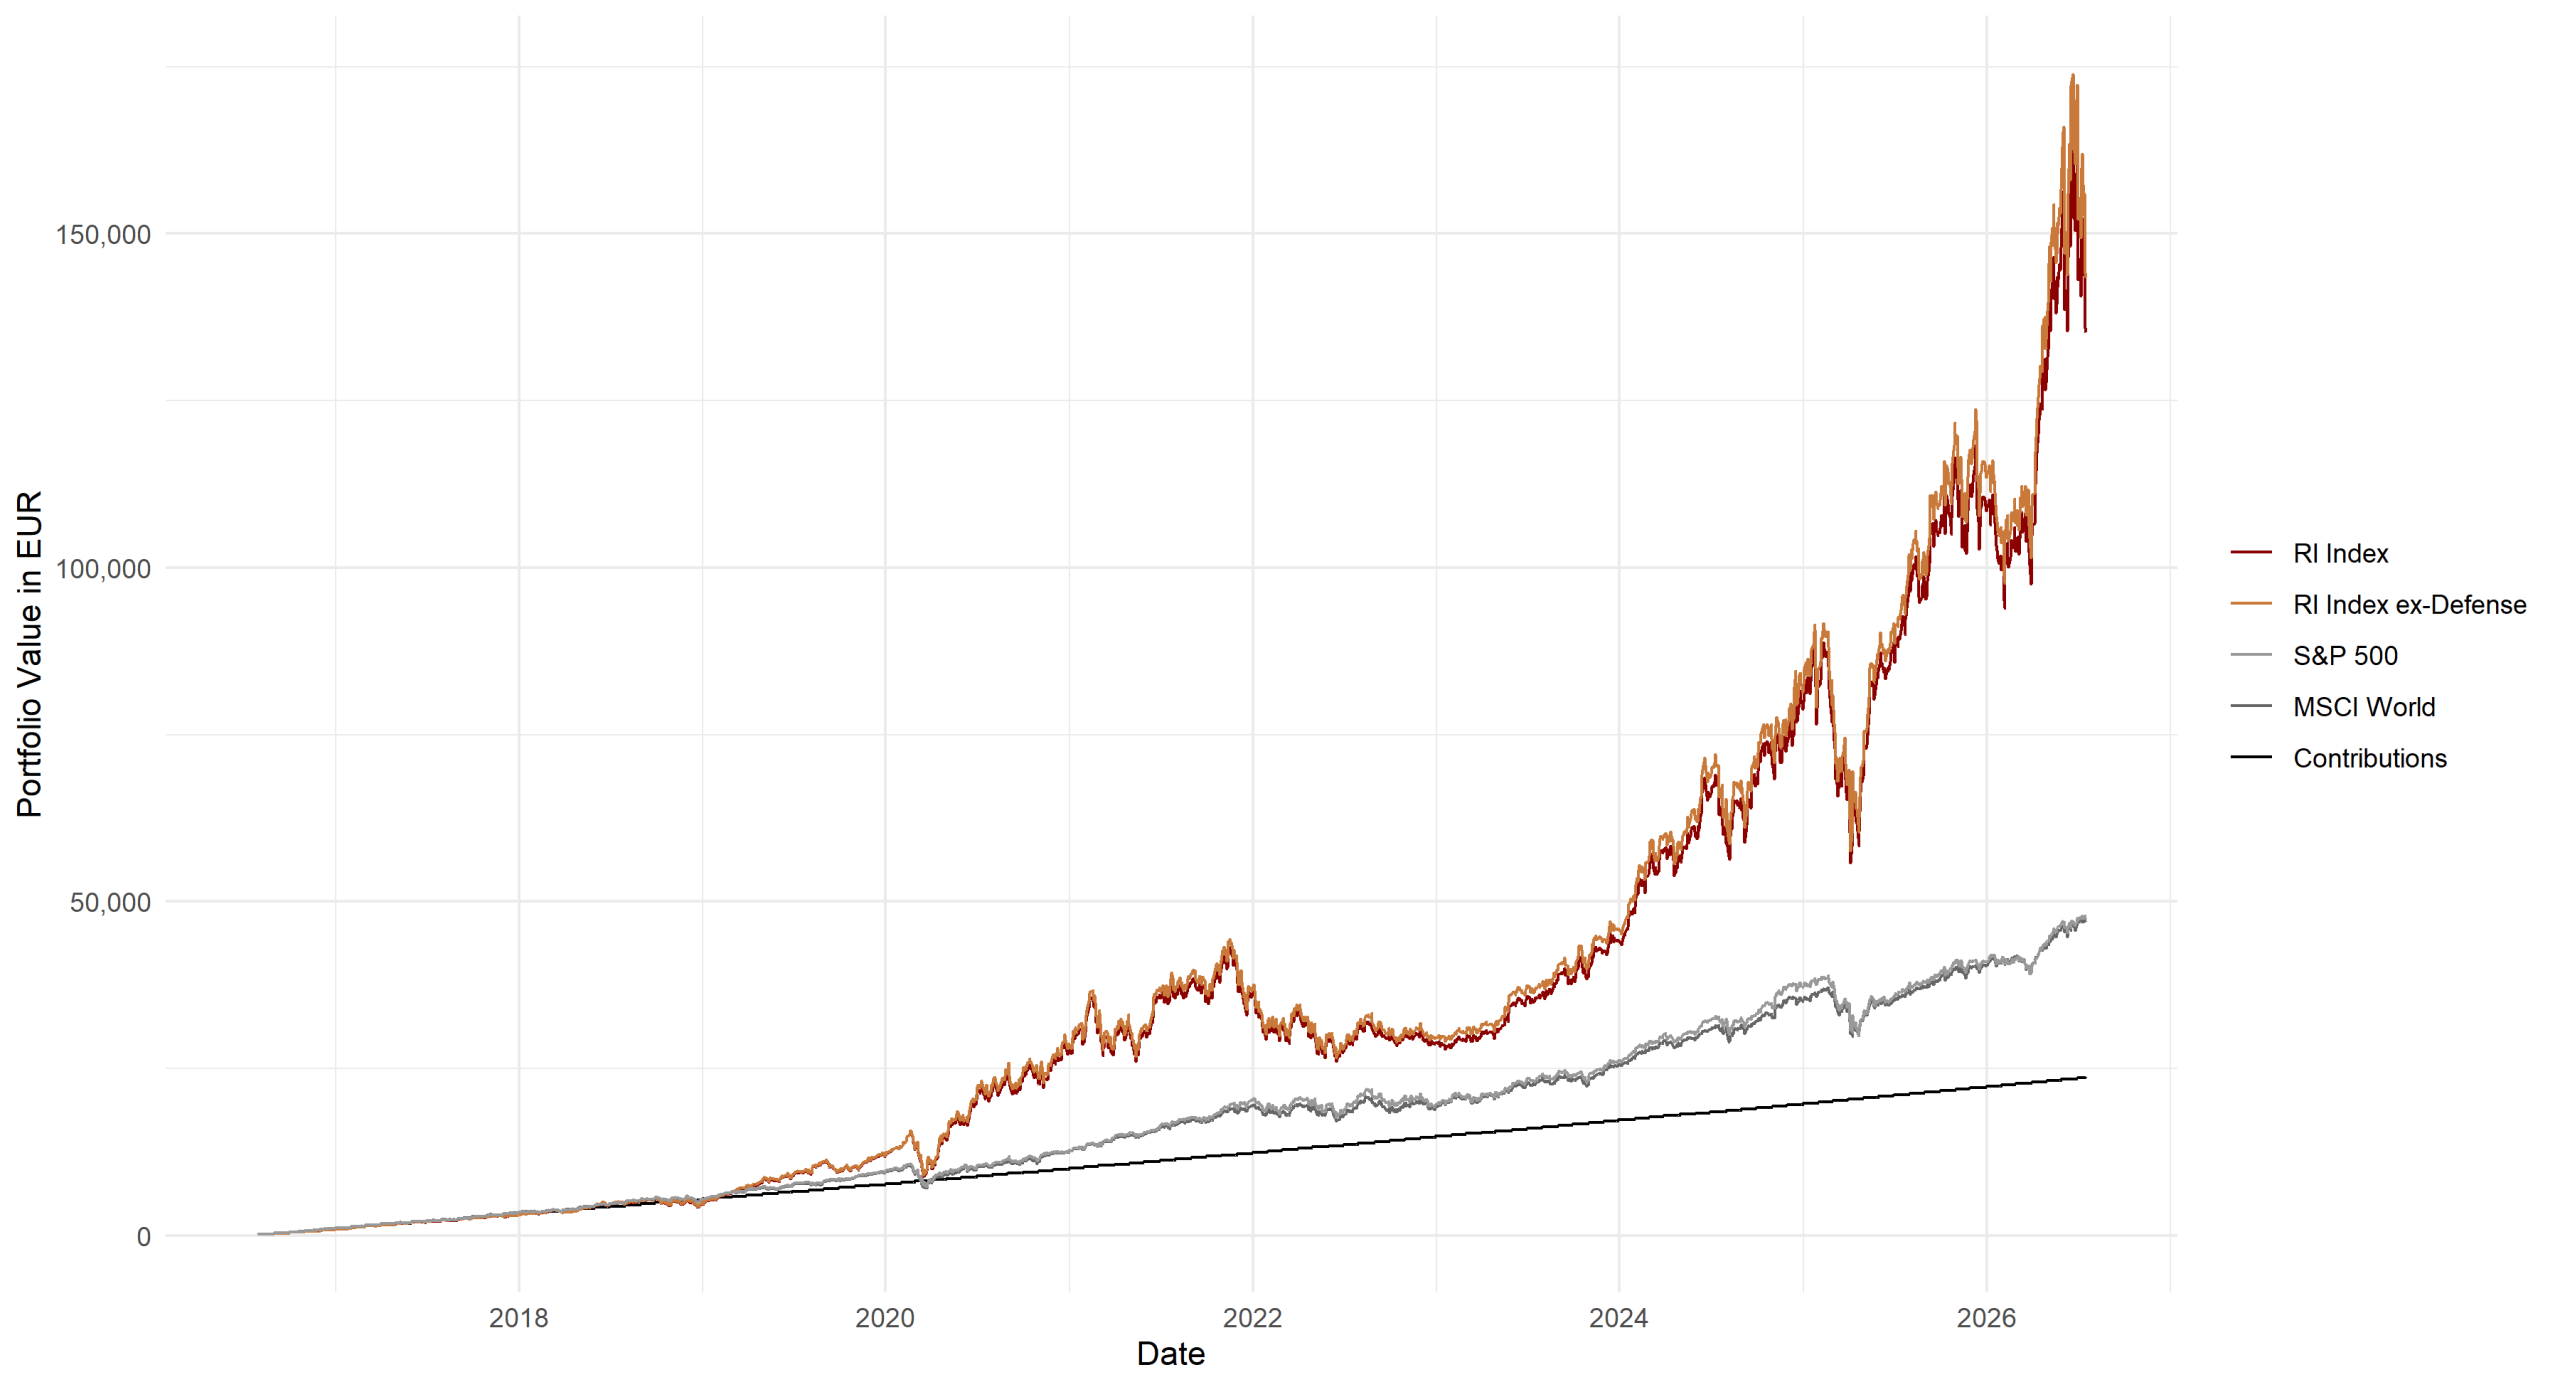
The model applies monthly updates to the index composition based on the RI Indicator. Equities that no longer meet the selection criteria are removed. When an equity is removed, the analysis assumes that it is sold and that the proceeds, together with the monthly contribution, are reinvested according to the prevailing index weights.
The table below presents performance metrics derived from the historical analysis.
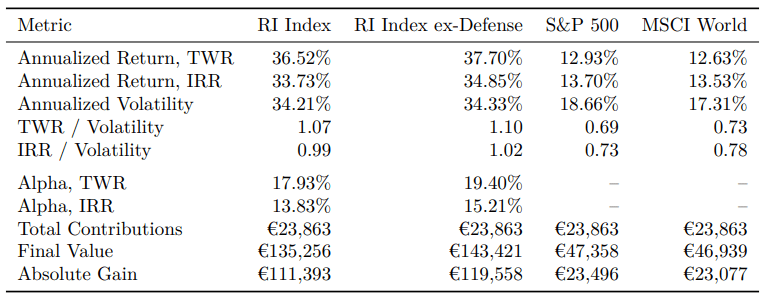
TWR (Time‑Weighted Return): Measures the pure investment performance of the portfolio, independent of the timing and size of cash flows. The TWR is suitable for comparing different investment strategies because it evaluates only the quality of the portfolio allocation — not the investor’s contribution behavior. It answers the question: How strong was the investment strategy itself?
IRR (Internal Rate of Return): The IRR is the discount rate at which the net present value of all cash inflows and outflows equals zero. It incorporates the timing and size of every cash flow, thereby reflecting the investor’s actual realized return — including transaction costs. It answers the question: What return did the investor personally achieve?
The alpha shown here is the purely arithmetic, deterministically decomposed residual component of the annualized return differential between the illustrated portfolio and an equally weighted, monthly 1/N-rebalanced auxiliary portfolio drawn from the same equity universe (gross, before fees and spread), thereby neutralizing systematic universe effects relative to broad indices such as the S&P 500 or MSCI World.
In my private investments, I align my personal approach with the methodology of the RI Index.
For further information about the RI Index methodology, please contact RI by email.
Disclaimer: This content was prepared by Return Insights for informational and analytical purposes only. It is intended solely to present statistical analyses based on historical market data. All metrics, charts, and calculations are based on past price developments and serve to describe observed market behavior. Future returns and risk profiles may differ from historical observations due to changing market conditions. Despite the utmost care in data collection and processing, no guarantee can be made regarding the accuracy, completeness, or timeliness of the information presented. All calculations have been performed to the best of RI’s knowledge. Data sources include Yahoo Finance and FRED (Federal Reserve Economic Data). The information contained in this content does not constitute regulated financial analysis, investment advice, investment recommendations, or a solicitation to buy, sell, or hold any financial instrument.
Additional information for U.S. residents: The information is general and impersonal in nature. This is not investment advice under the Investment Advisers Act of 1940. Return Insights does not provide personalized investment recommendations. This publication qualifies for the publisher’s exclusion.
Additional information for UK residents: The content is provided solely for analytical and educational purposes. This content is not a financial promotion under UK law. It does not constitute investment advice or an inducement to engage in investment activity. Return Insights is not authorized or regulated by the FCA.
Additional information for Canadian residents: This content does not constitute investment advice or a recommendation under Canadian securities laws. Return Insights does not provide personalized investment advice and is not registered as an adviser in Canada. Return Insights does not consider the investment needs or objectives of any individual. The information is general in nature and provided for analytical and educational purposes only.
Additional information for Australian residents: This content does not constitute financial product advice as defined under Australian law. Return Insights is not licensed by ASIC to provide financial services in Australia and does not hold an Australian Financial Services License (AFSL). The information is general in nature, does not consider your personal circumstances, and is provided for analytical and educational purposes only.
Additional information for Singapore residents: This content does not constitute financial advice or a research report under Singapore law. Return Insights is not licensed by the Monetary Authority of Singapore (MAS) to provide financial advisory services. The information is general in nature, does not consider your personal circumstances, and is provided for analytical and educational purposes only. This information is not intended for distribution to persons in Singapore to whom such distribution is not permitted under Singapore law.